Understanding the QuickPlanX Window
QuickPlanX operates as a multi-window application. Each window displays and manages a single project, providing you with a dedicated workspace for focused project management.
Project Window
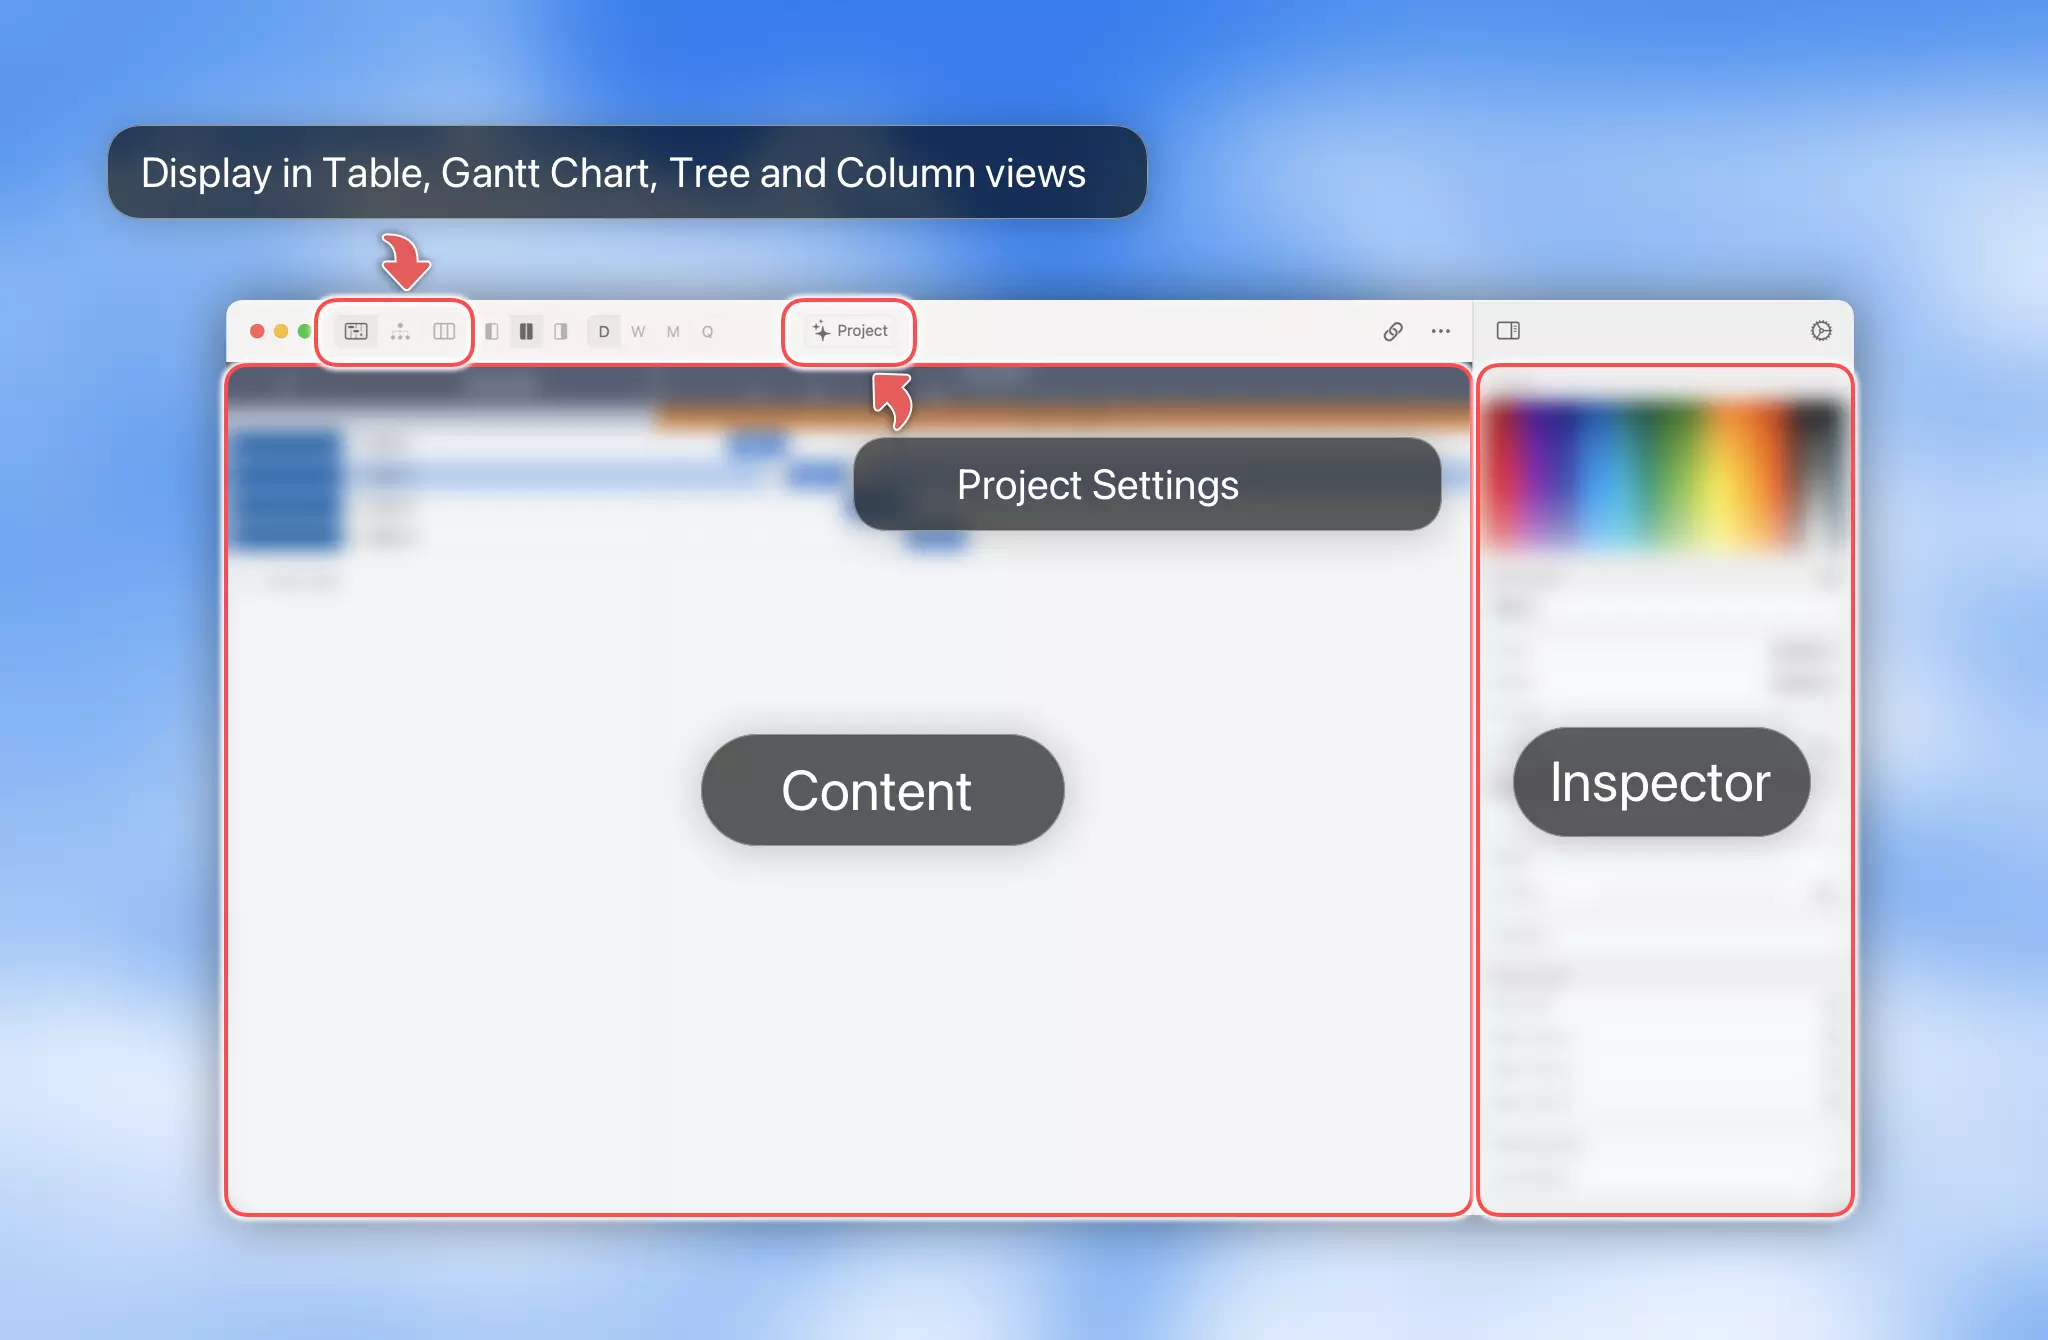
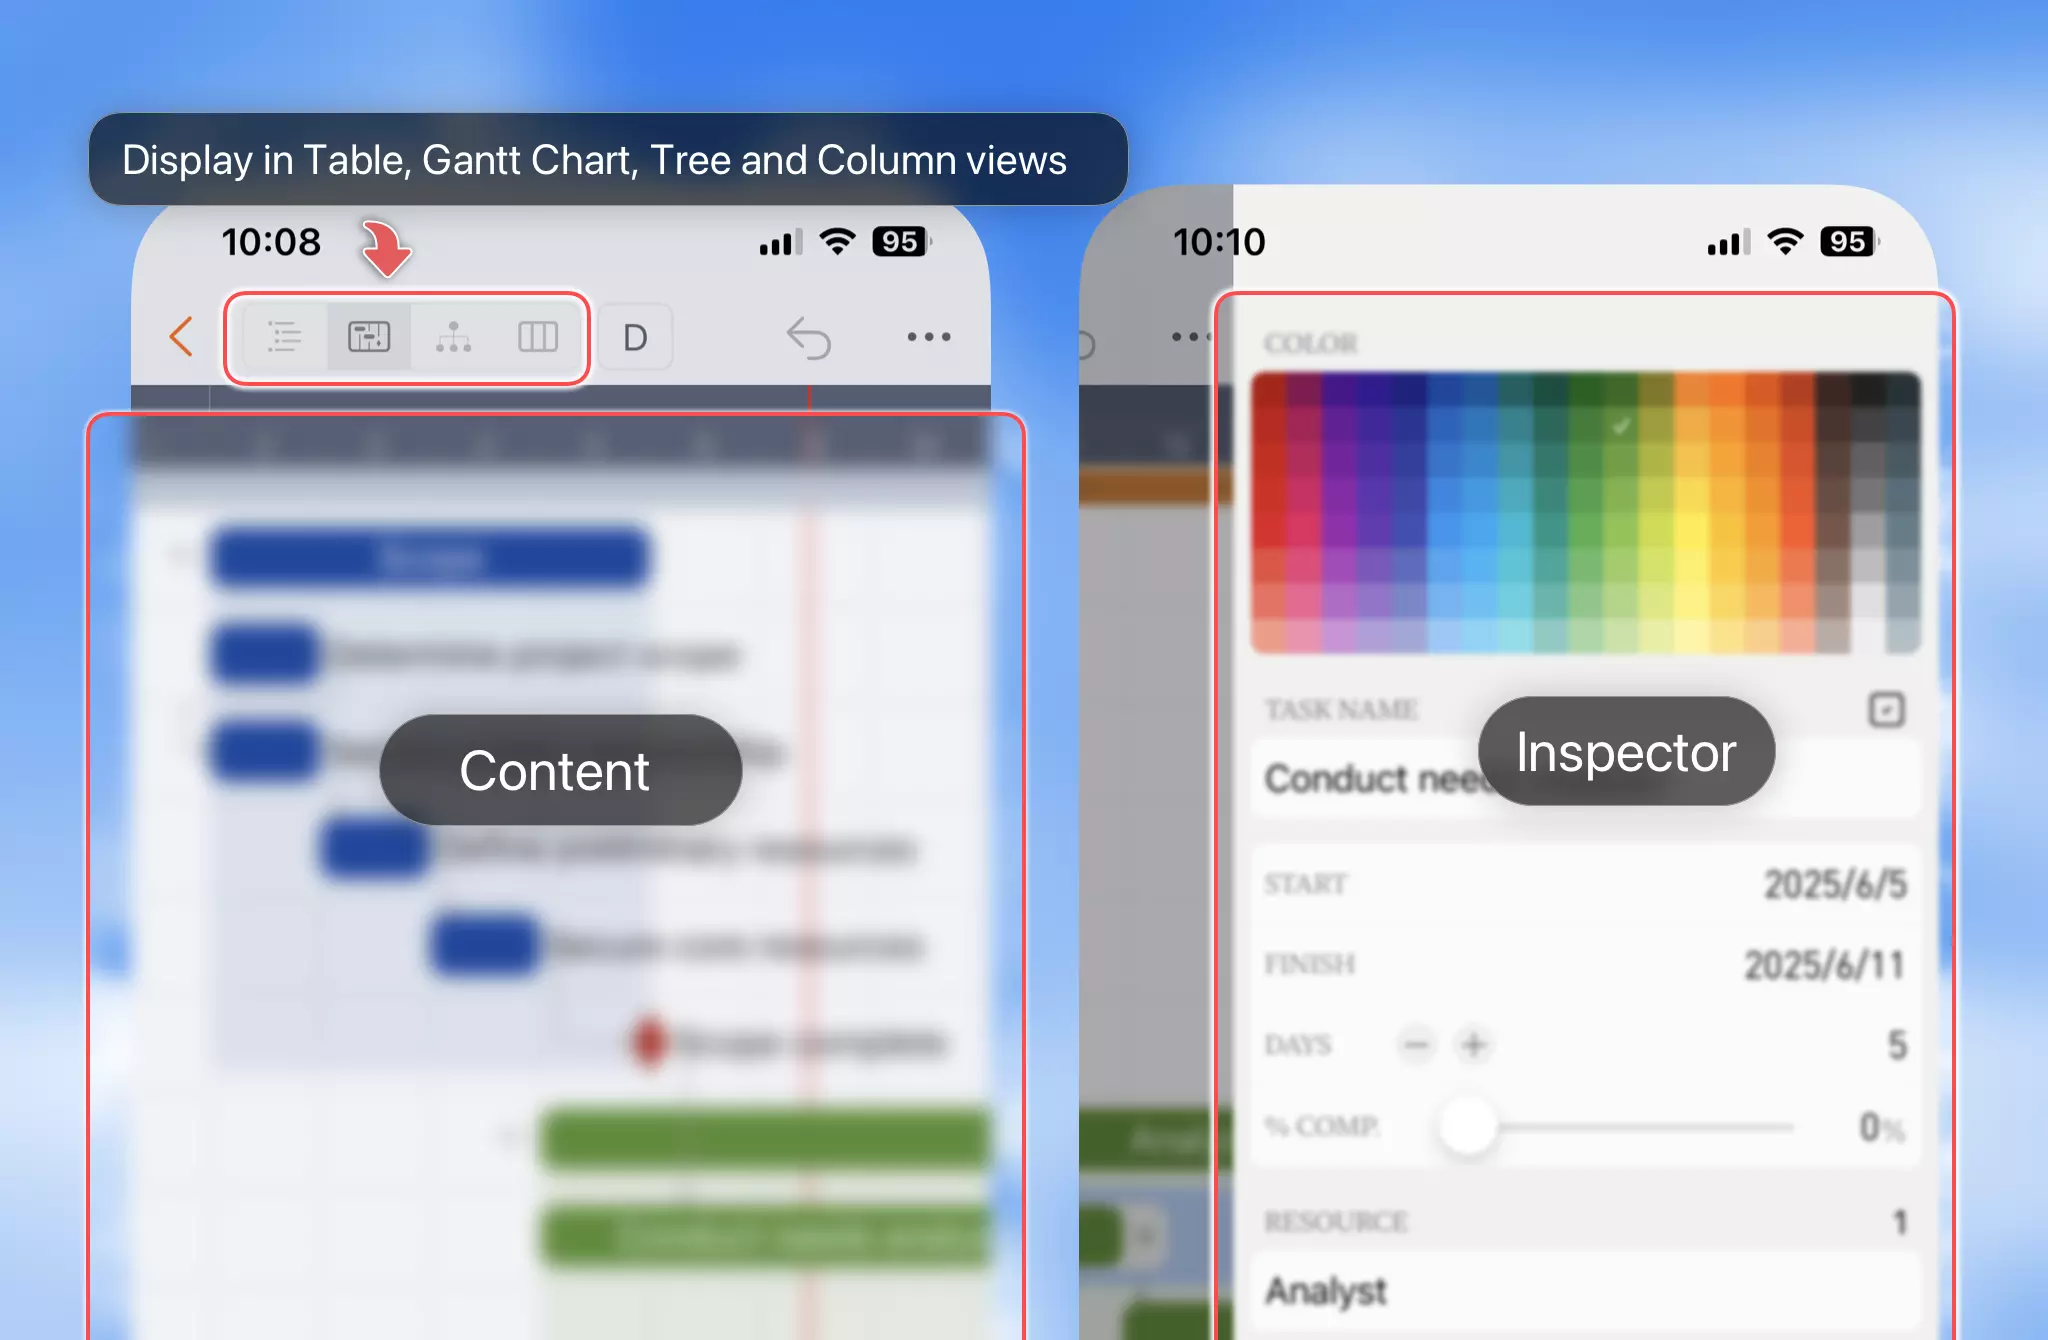
QuickPlanX opens a project in a window to display and manage the components of a tree structure in Table, Gantt Chart, Tree, and Column views. With the Inspector, you have the freedom to edit node properties and customize the node's display as needed. The toolbar in each window provides essential buttons to change project settings, export the project to CSV, image, and PDF files, switch content views, lock the project, and more. In the app menu, you can find additional functions depending on the context.
Mac
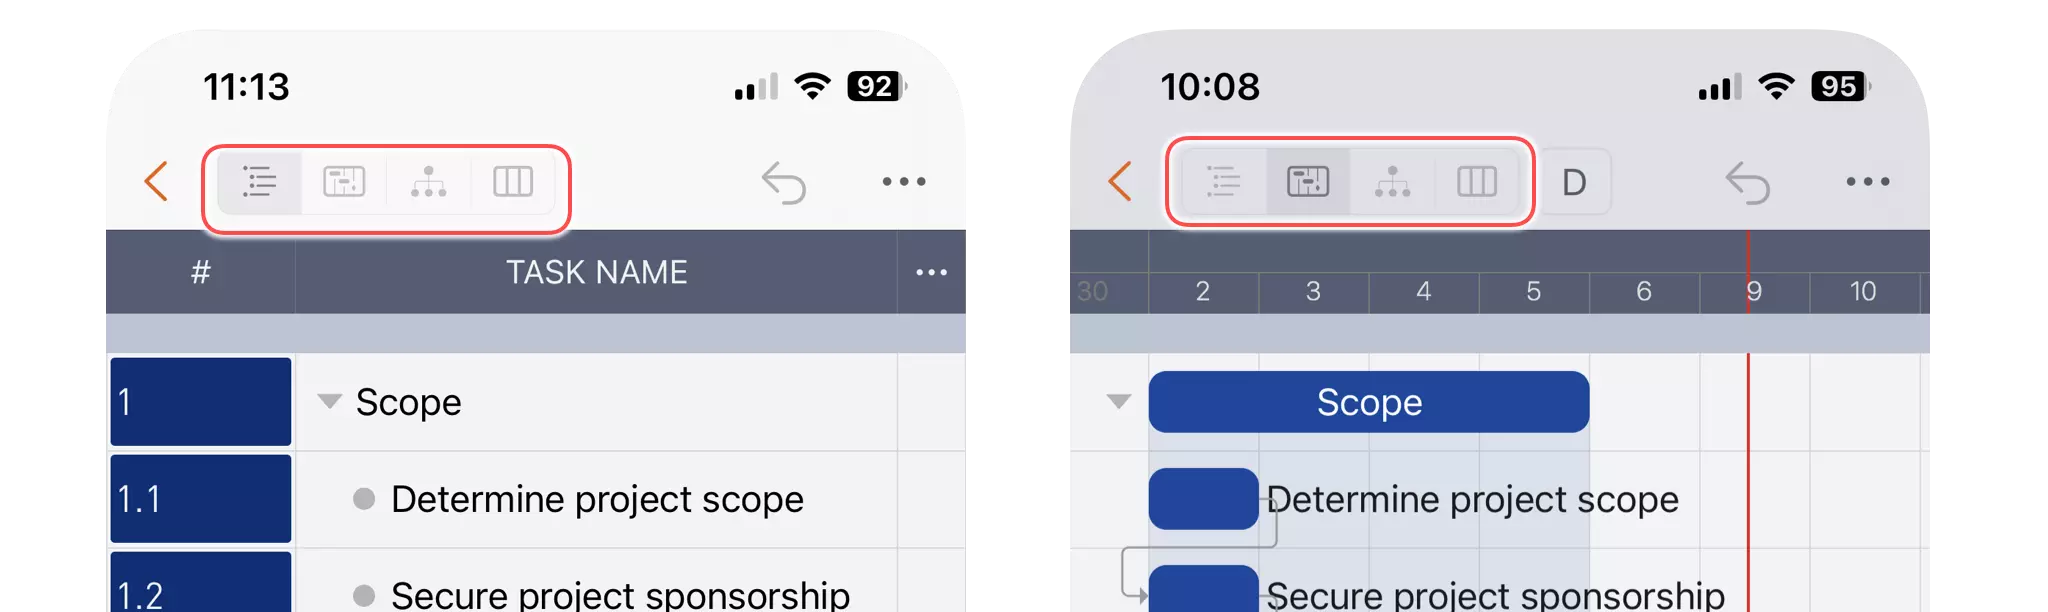
iPhone
iPad
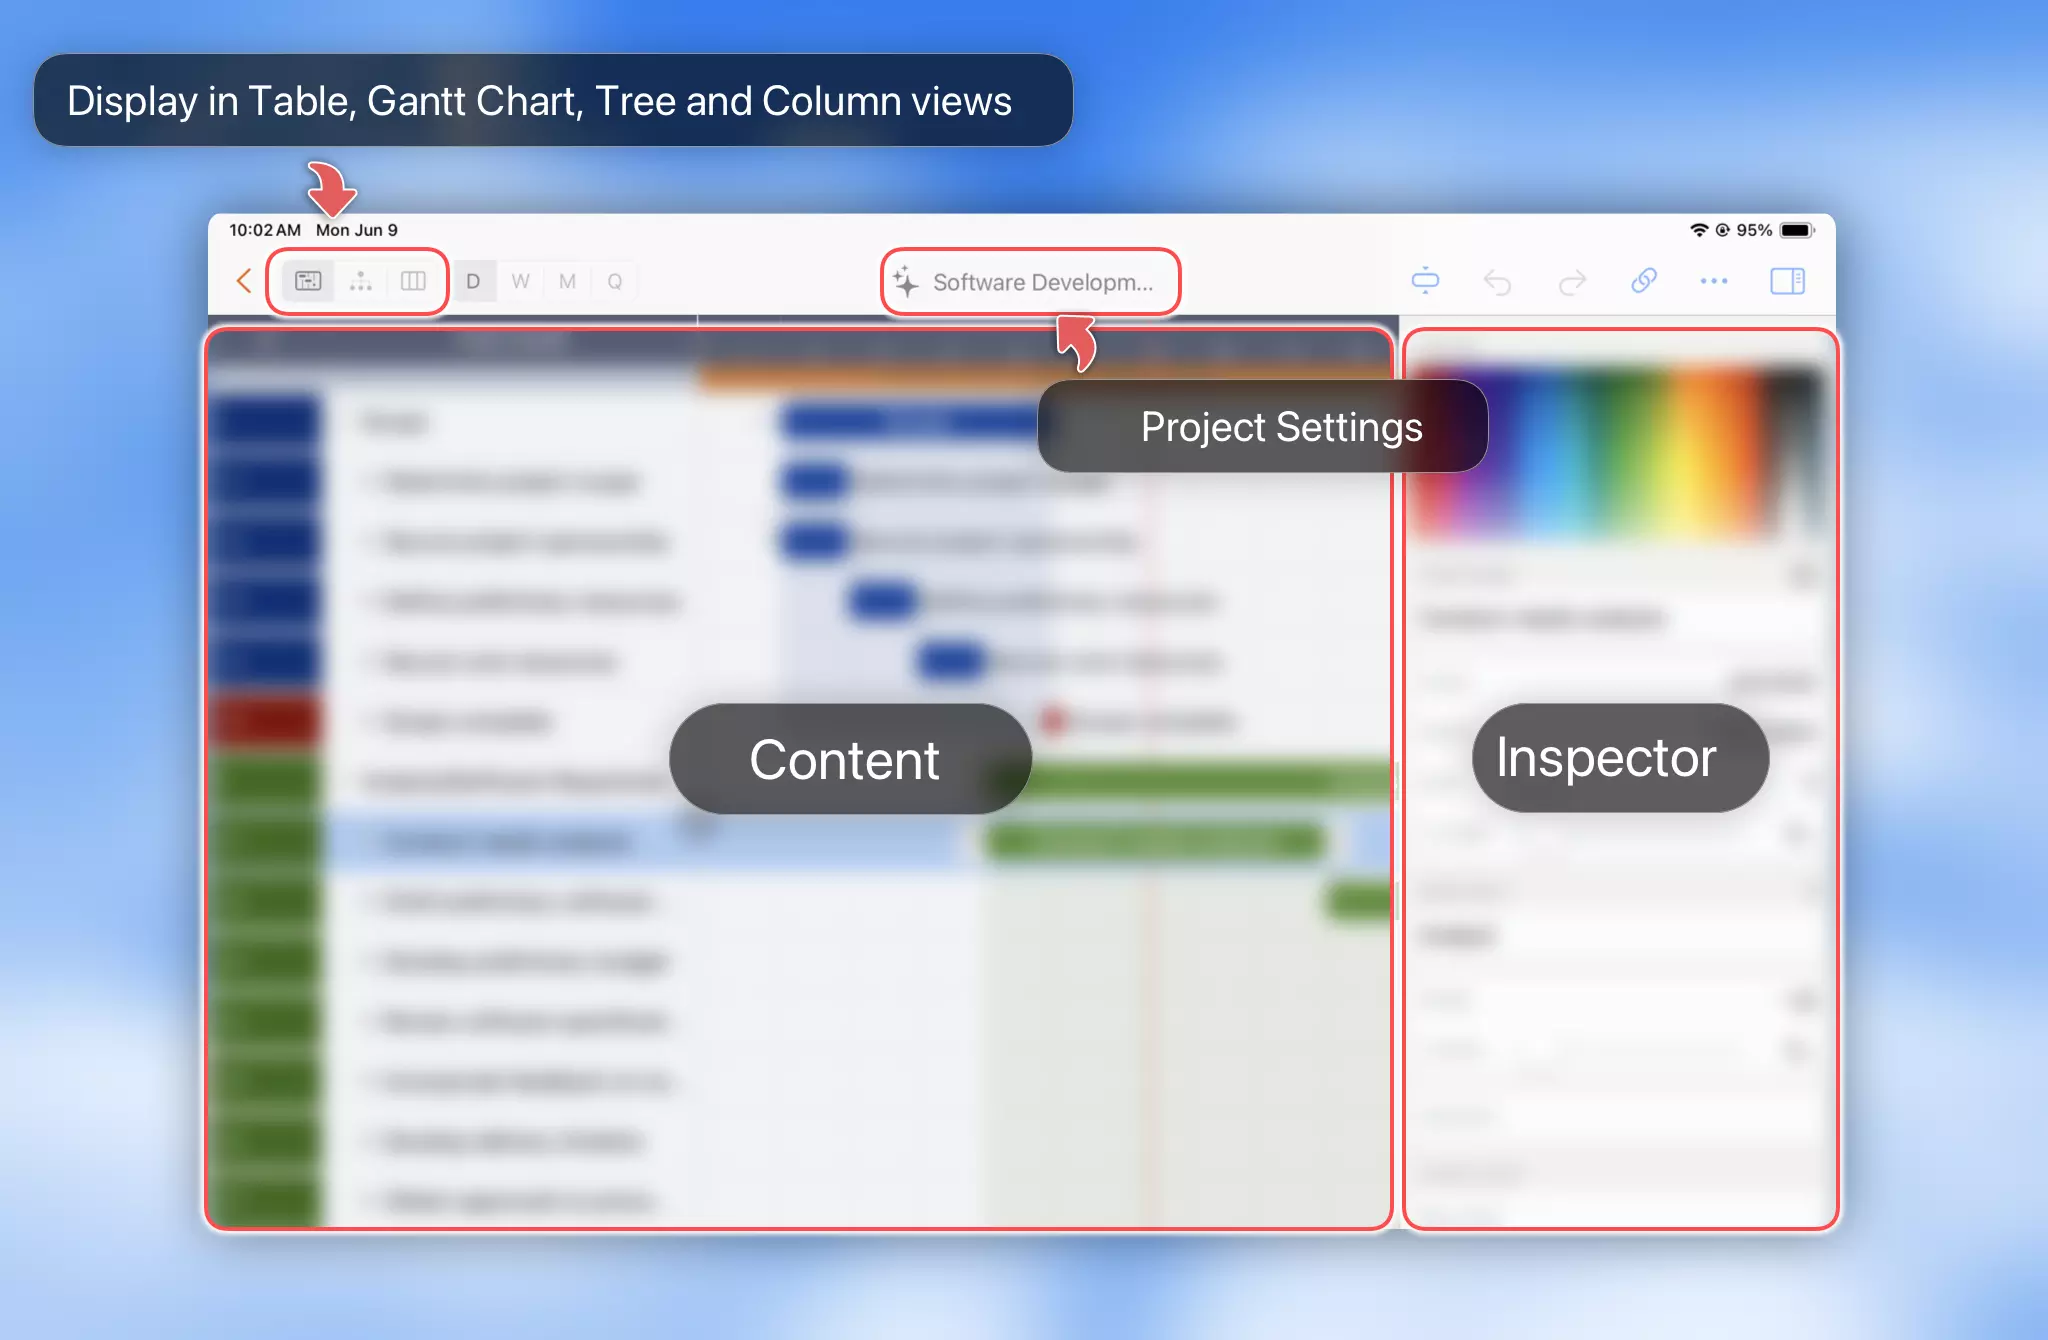
Table View & Gantt Chart
The Gantt Chart and Table View form the primary user interface for maintaining a project. These are the fundamental views that all project scheduling applications provide.
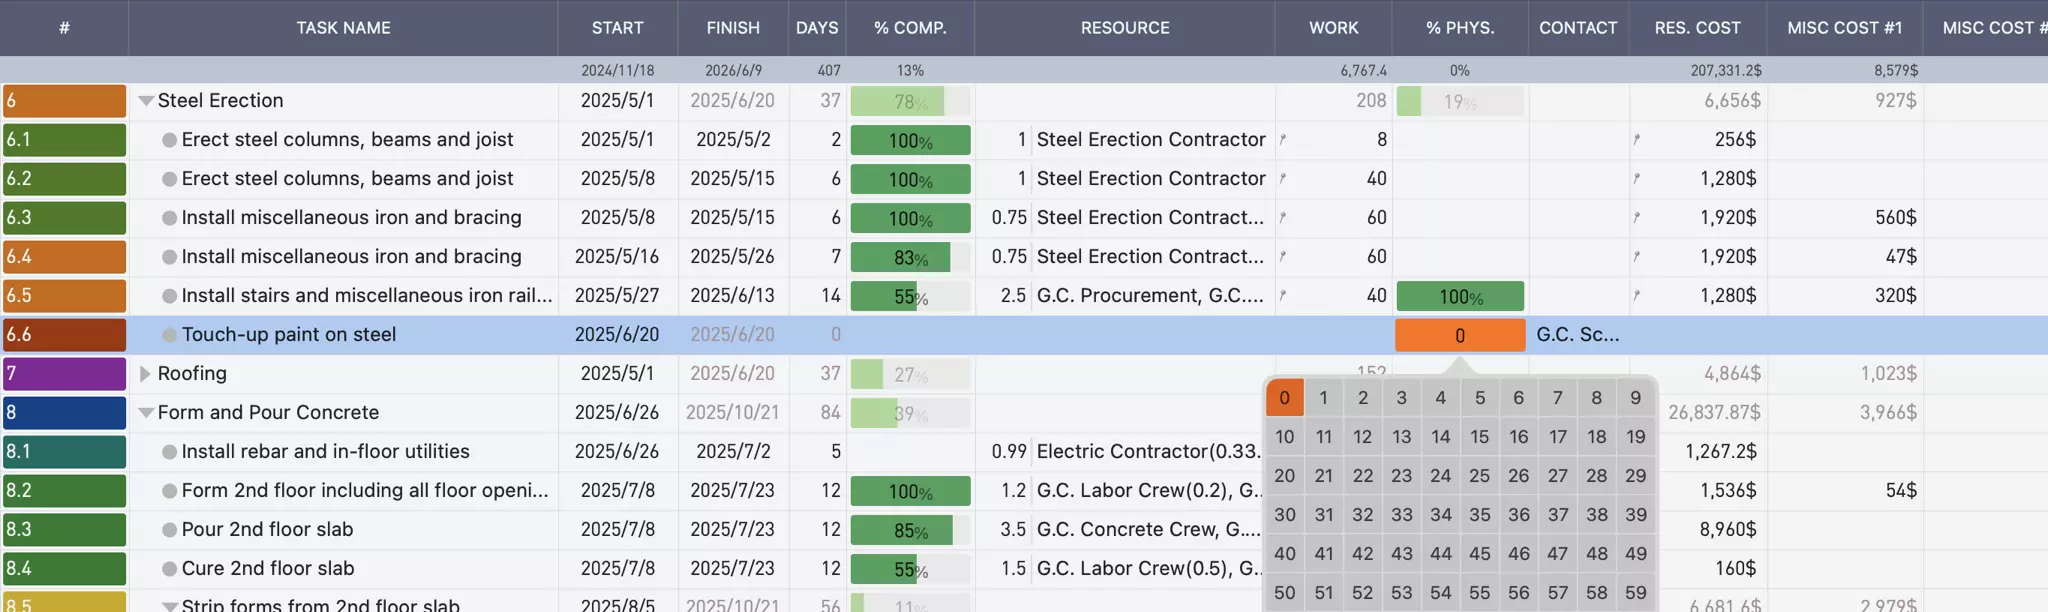
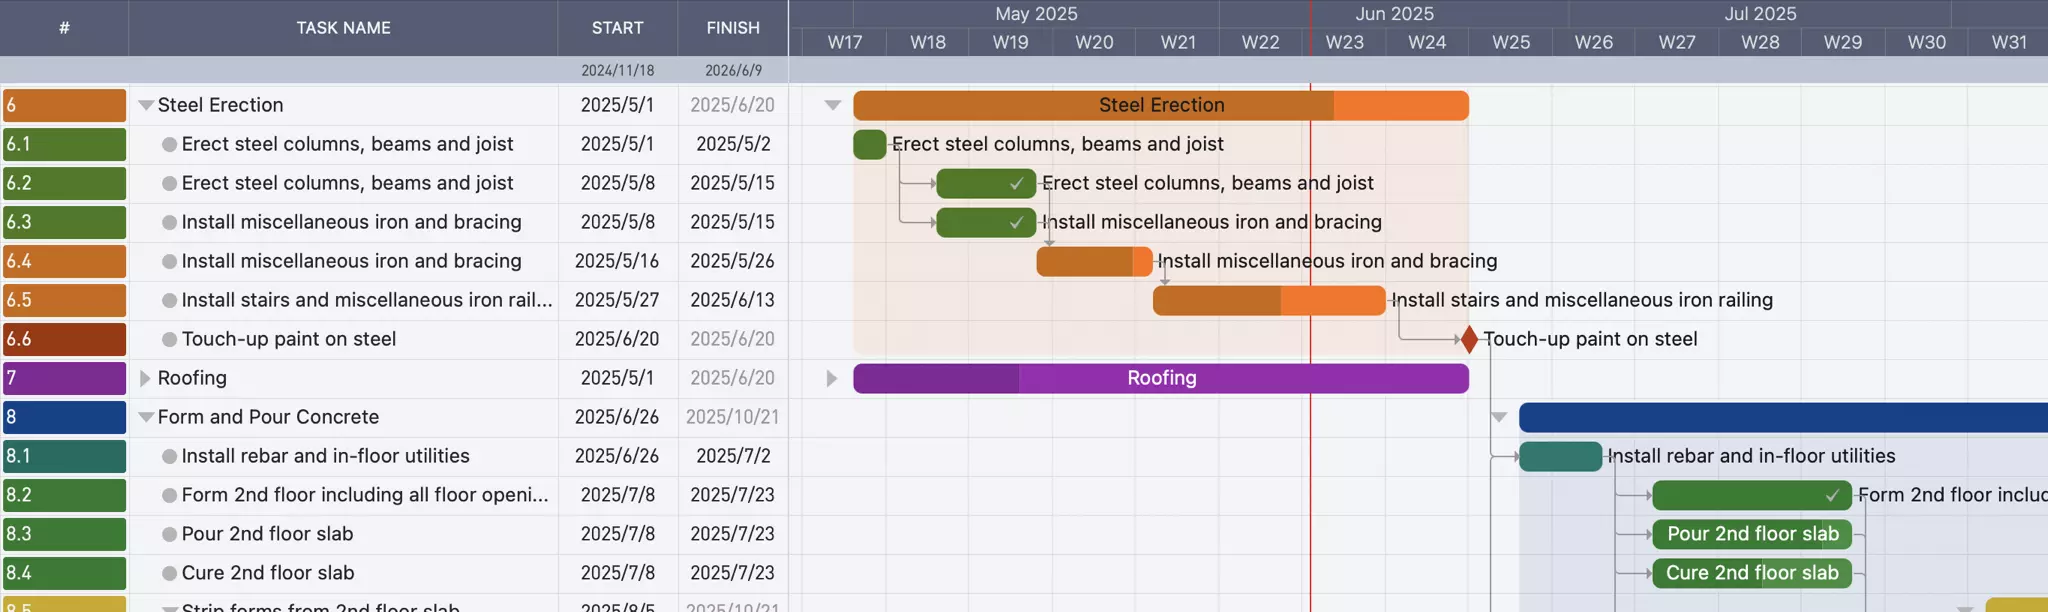
Table View
The "Table View" functions like a simple spreadsheet. You can navigate between rows and columns and edit the selected cell directly.
Learn more about creating tasks in the Table View & Gantt Chart →
Learn more about updating task data in the Table View →
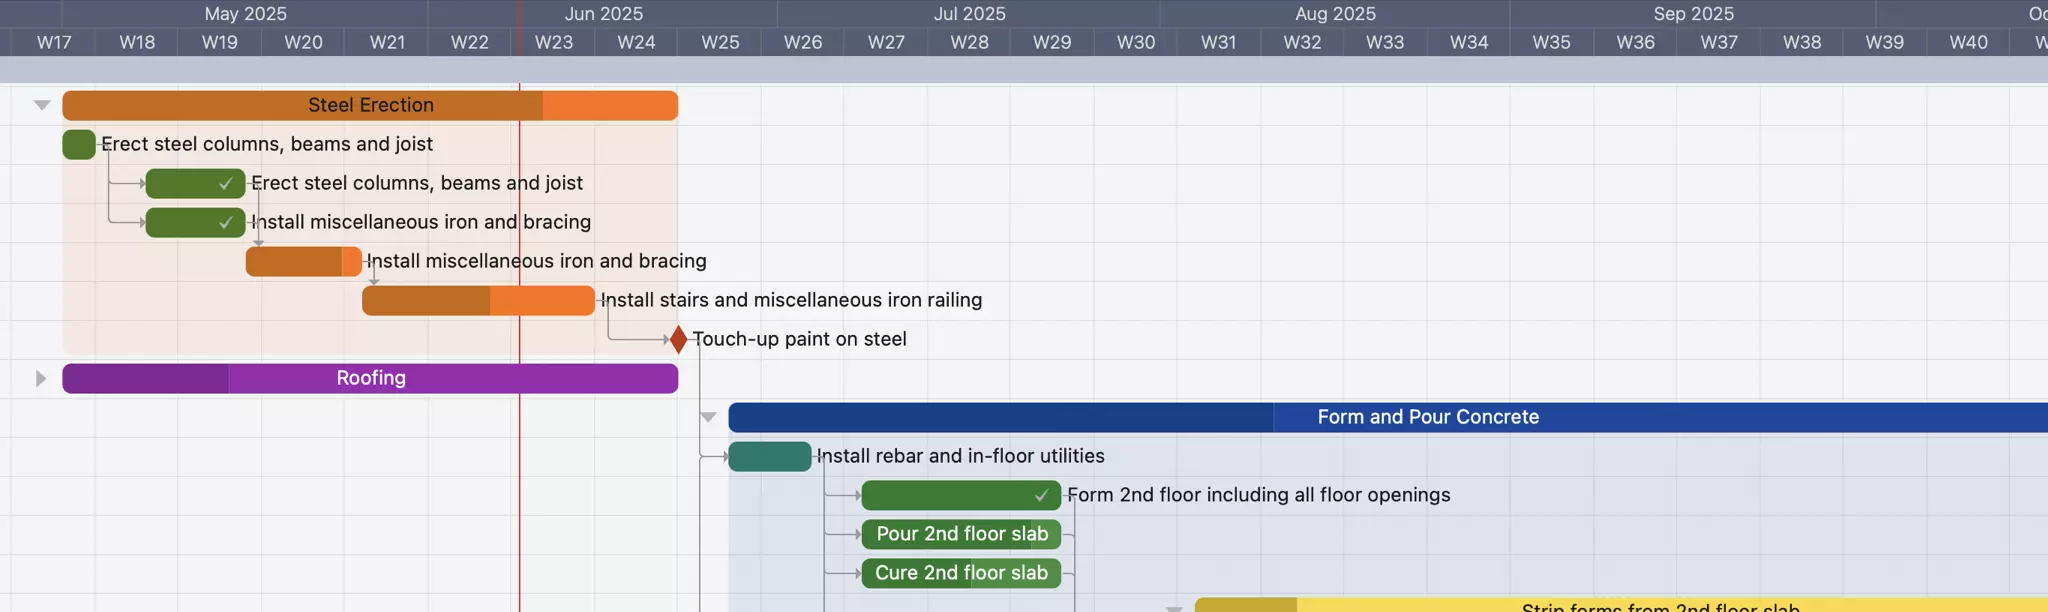
Gantt Chart
The "Gantt Chart" provides a visual timeline representation of your project tasks, showing their duration, dependencies, and progress in a horizontal bar chart format. This view helps you understand project scheduling and identify potential bottlenecks or conflicts.
Learn more about creating tasks in the Table View & Gantt Chart →
Layout
QuickPlanX displays the Table View and Gantt Chart differently based on your device's screen size and capabilities.
On Large Screens
On both Mac and iPad, QuickPlanX gives you the flexibility to display the Table View and Gantt Chart either side by side or individually. You can configure this behavior in the app’s settings.
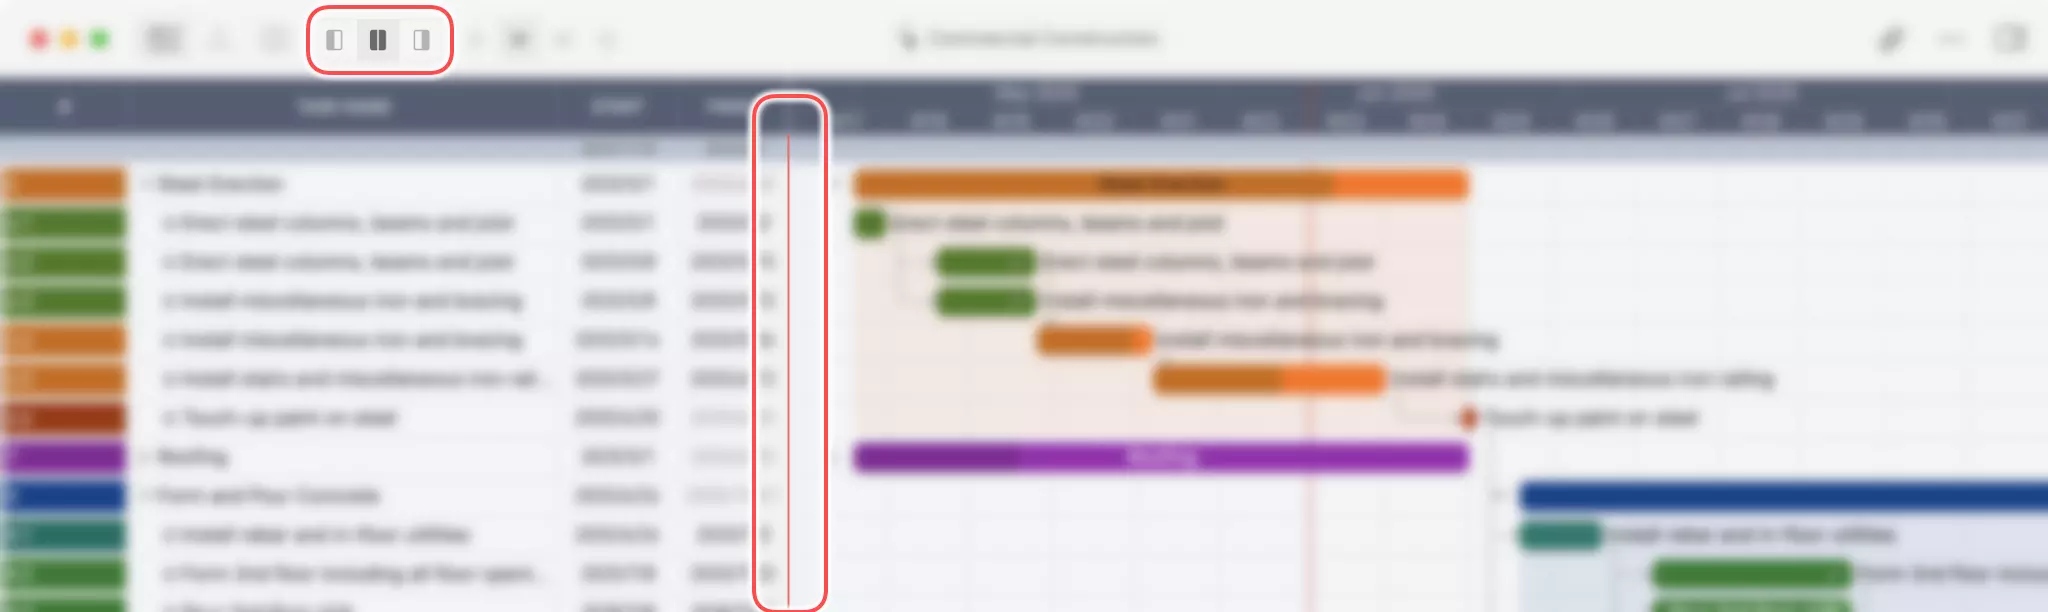
On Mac
When both views are shown together, you can adjust their widths by dragging the splitter (a simple line) between them. The Mac version also provides dedicated toolbar buttons to quickly show or hide the Table View or Gantt Chart. If you move the splitter close to one edge, the app will automatically switch to display only one view. You can always bring back the hidden view using the toolbar buttons.
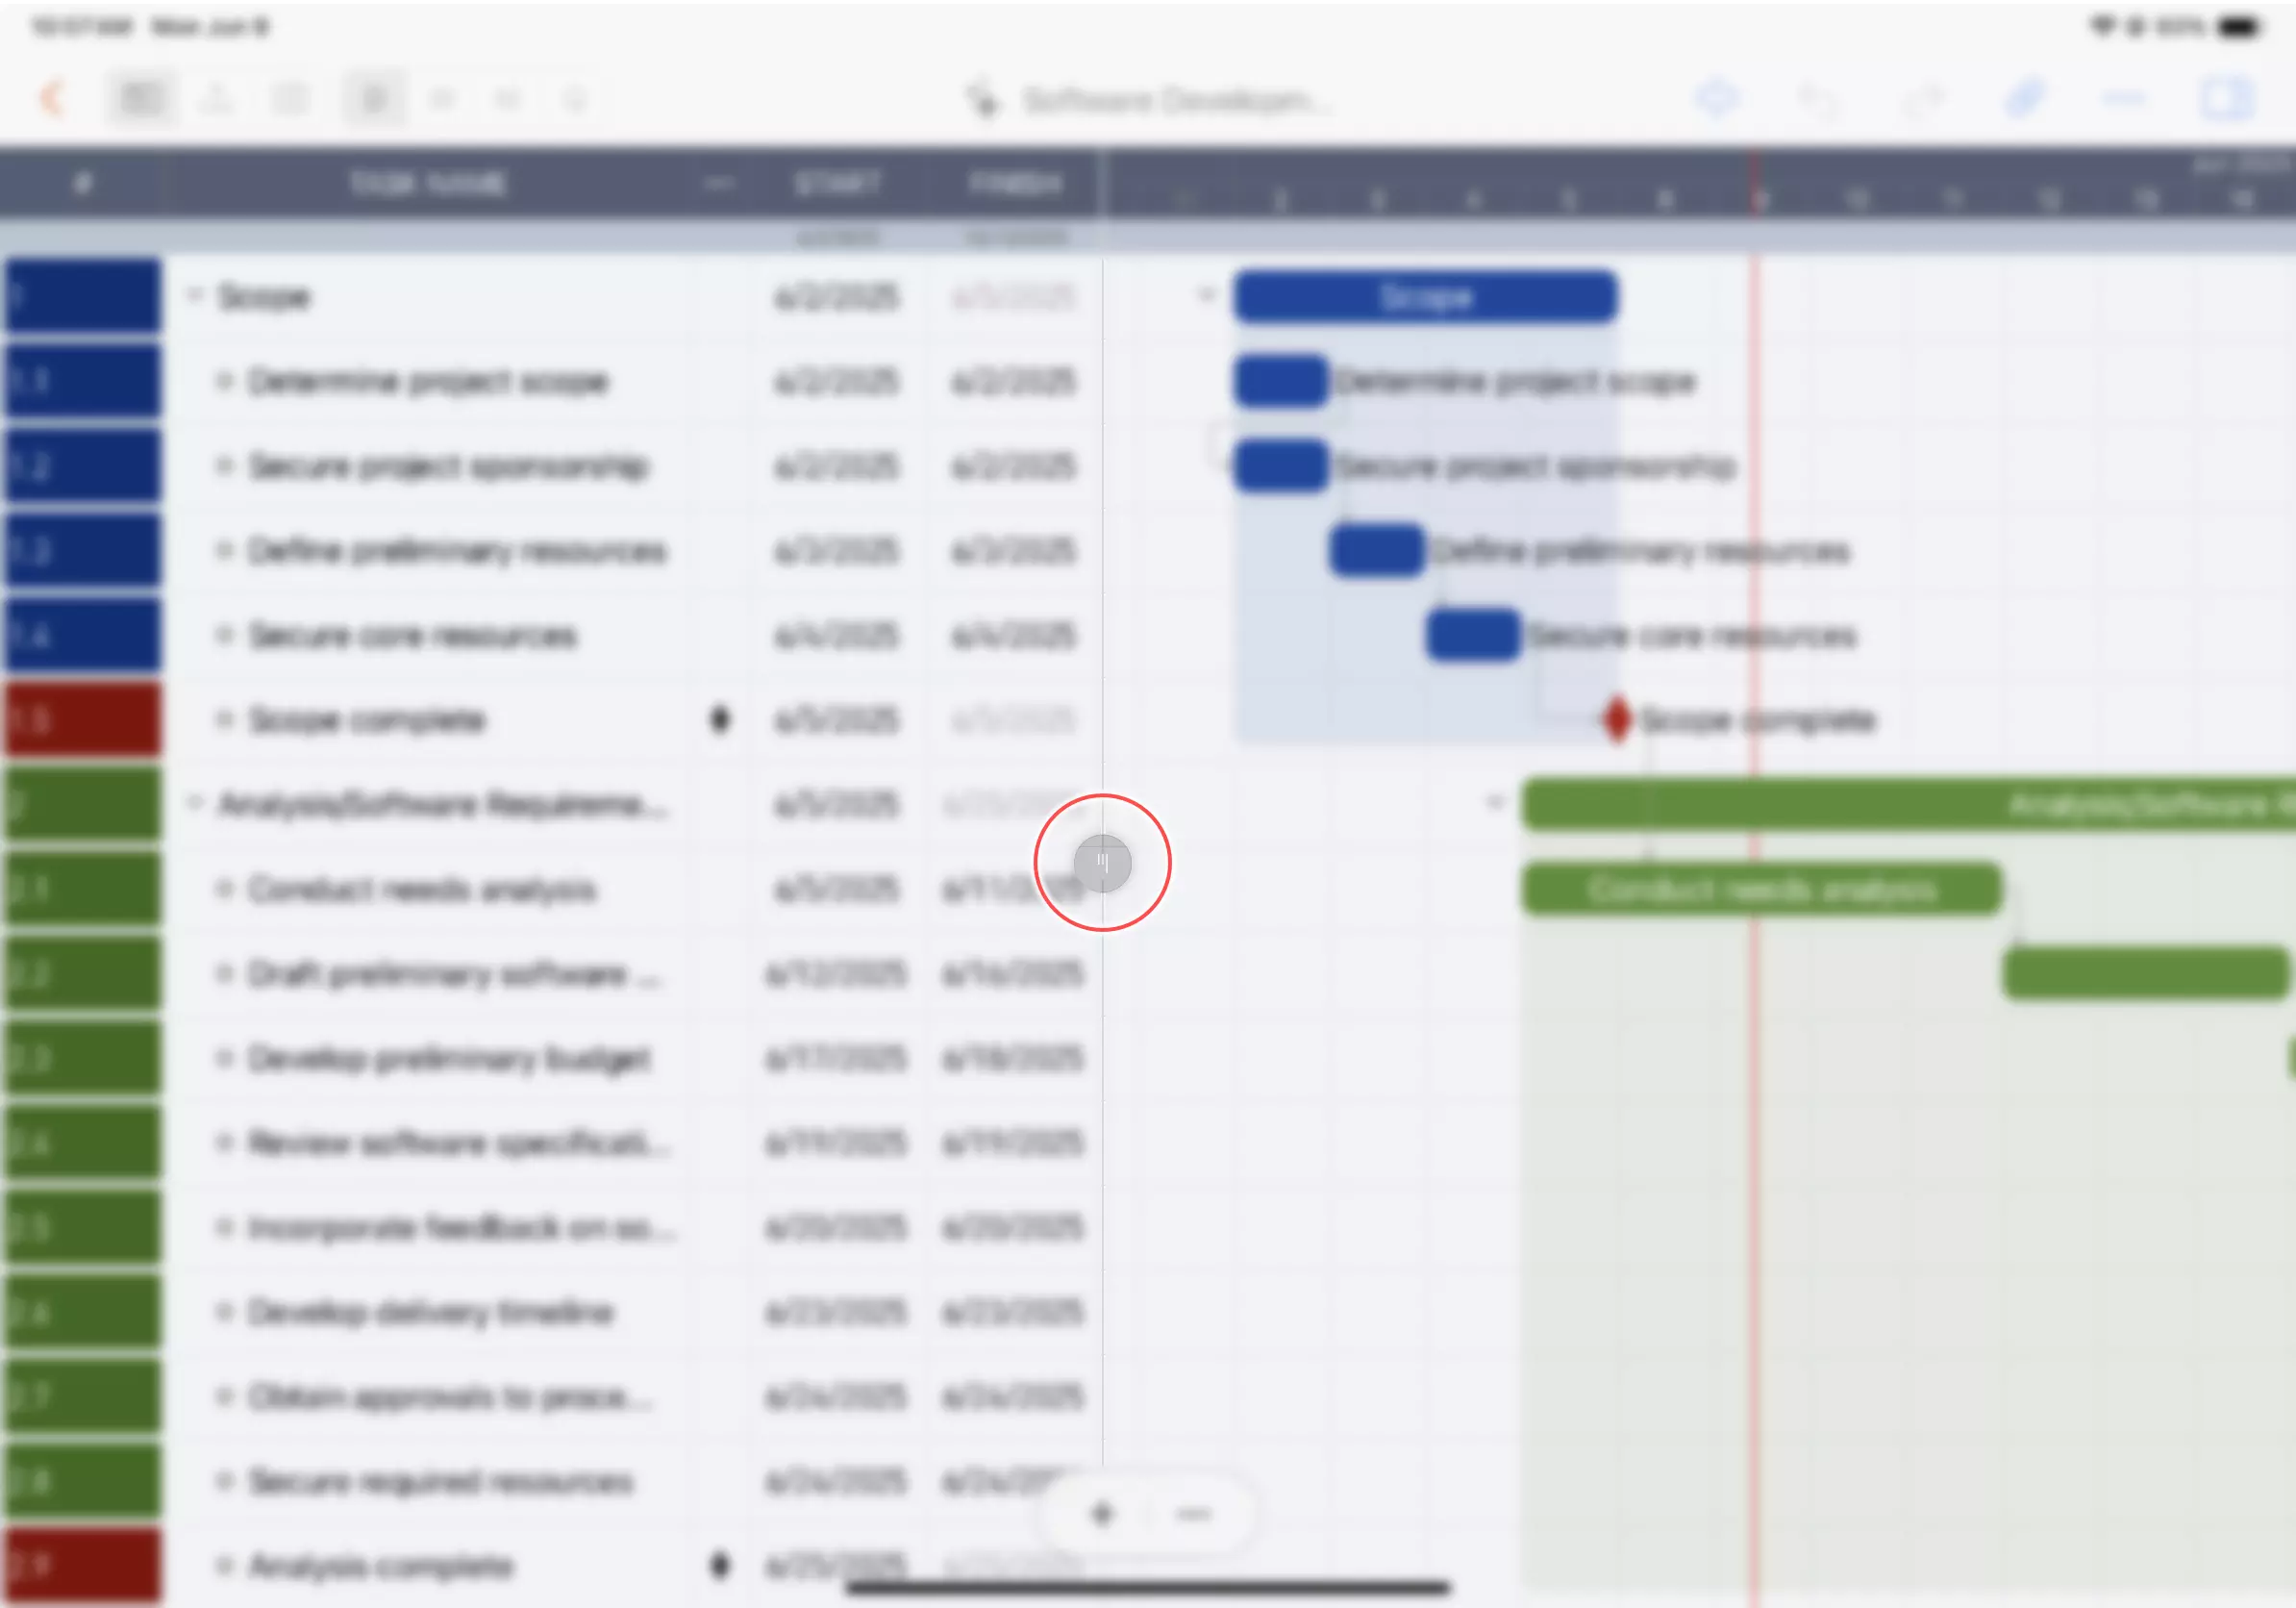
On iPad
On iPad, you can also adjust the width of the two views by dragging the splitter. The splitter on iPad features a circular button at its center, making it easy to grab and move. Unlike on Mac, there are no toolbar buttons to toggle the views. If you move the splitter close to one edge, the app will show only one view, but the circular button remains visible at the edge. You can simply drag this button back toward the center to reveal the hidden view again.
On Mobile Screen
On iPhone, the Table View and Gantt Chart are shown separately to accommodate the smaller screen size. A toolbar button allows you to easily switch between the two views.
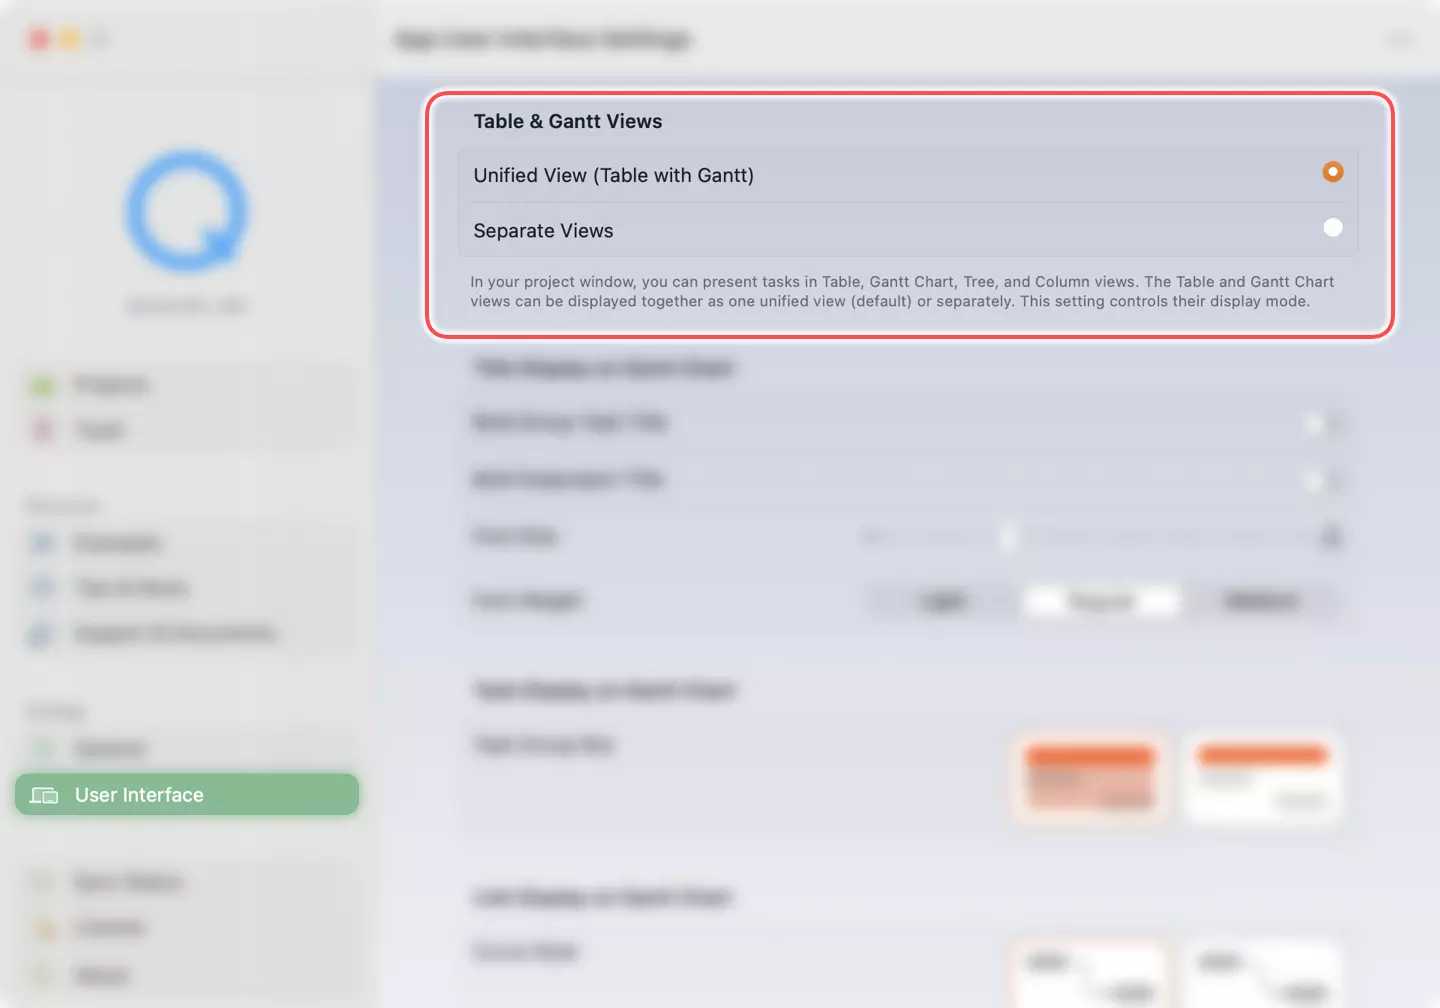
Settings
For Mac and iPad, there is an option in the app's settings to configure whether to show the Table View and Gantt Chart together or separately.
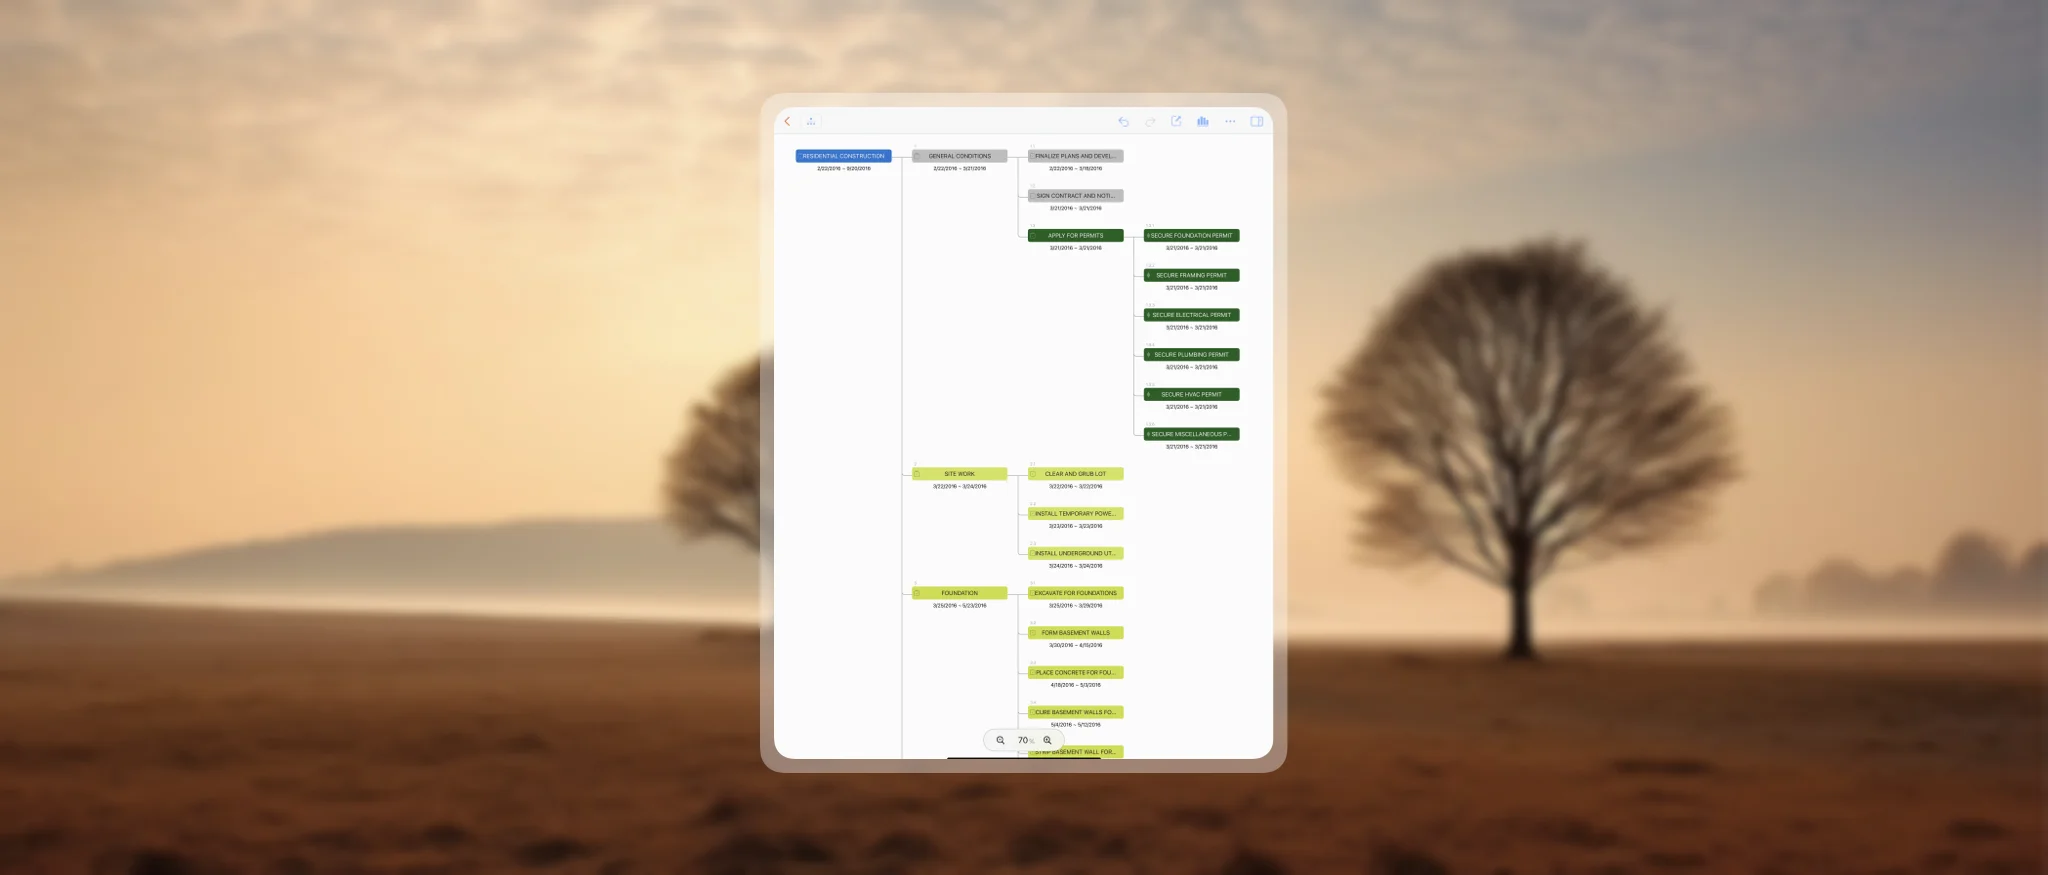
Tree View
The "Tree View" renders the project in its natural hierarchical tree structure. You can zoom in and out, pan around the tree view, and drag and drop tasks to rearrange the task hierarchy intuitively.
Learn more about creating tasks in the Tree View →
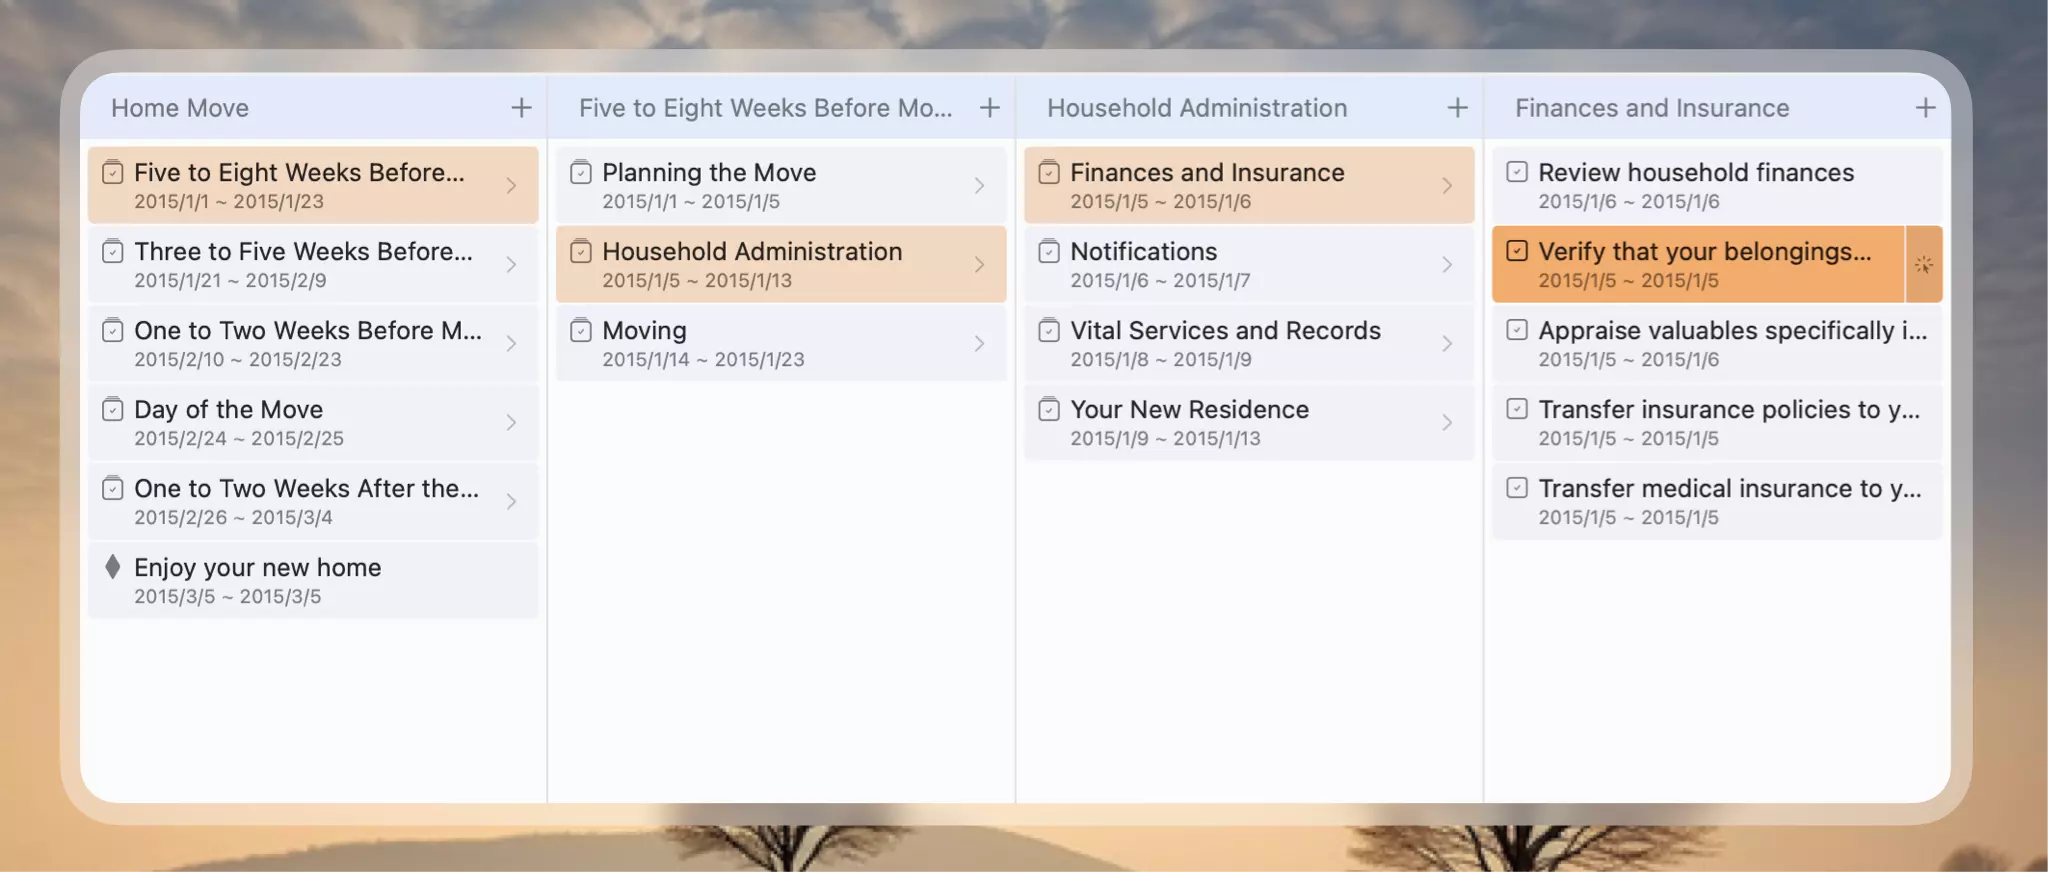
Column View
The "Column View" is similar to the column view in the macOS Finder application. You can browse the project task hierarchy by selecting a task in each column, allowing for easy navigation through complex project structures.
Learn more about creating tasks in the Column View →
Inspector
The "Inspector" is the central place to edit properties and display styles of the selected node. You can access the inspector by tapping the "Inspector Toggle" button on the toolbar or by double-clicking on a node. The inspector provides comprehensive controls for customizing task attributes, formatting, and behavior.